
Figure 5.
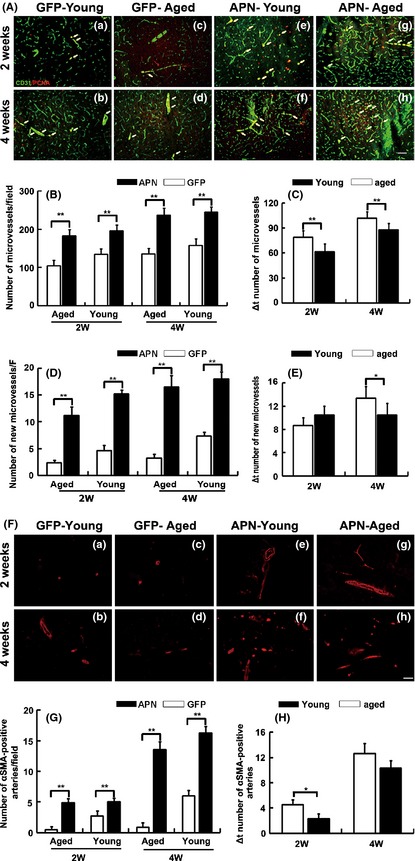
Angiogenesis was increased in aged mice with AAV‐APN gene transfer after tMCAO. (A) Photomicrographs showed the CD‐31 and PCNA double immunostaining in perifocal region in AAV‐APN transduced aged mouse brain 2 and 4 weeks after tMCAO. AAV‐APN transduced young adult mice and AAV‐GFP transduced aged mice were as control. Bar = 20 μm. (B) Bar graph showed the number of microvessels in AAV transduced aged and young adult mice. Values are mean ± SD, N = 6 in each group. **P < 0.01, APN versus GFP groups. (C) Bar graph showed that the number of microvessels between aged APN and young adult APN groups. **P < 0.01, aged APN versus young adult APN group. (D) Bar graphs showing the number of newly formed microvessels in the AAV‐APN transduced aged mice. Data are mean ± SD, n = 6 per group. **P < 0.01, APN versus GFP groups. (E) Bar graph showed that the number of microvessels between aged APN and young adult APN groups. Data are mean ± SD, n = 6 per group. *P < 0.05, aged APN versus young adult APN group. (F) Photomicrographs showed SMA‐positive cells in AAV‐APN transduced aged mouse brain 2 weeks and 4 weeks after tMCAO. (G) Bar graph showed the number of small arteries in the AAV‐APN transduced aged mice after 2 weeks and 4 weeks of tMCAO. Data are mean ± SD, n = 6 per group. **P < 0.01, APN versus GFP groups. (H) Bar graph showed that the number of small arteries between aged APN and young adult APN groups. Values are mean ± SD, N = 6 in each group. *P < 0.05, aged APN versus young adult APN group.