
Figure 1.
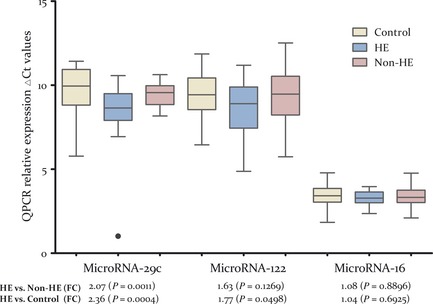
MicroRNAs differentially expressed between ICH patients with or without hematoma enlargement (HE) and normal controls. Note: The validation study using QRT‐PCR assays also showed miRNA‐29c and miRNA‐122 to be upregulated in HE cases versus non‐HE or HE cases versus normal controls. Schematic representation of miRNA‐29c and miRNA‐122 with differential expression among three groups (n = 30, 30, and 49 respectively) after the statistical test are shown. MiRNA‐16 is used as a no‐expression change representation of microarray data, given its relative stable expression level in plasma and serum like miRNA‐451. The y‐axis represents units of delta Ct (Ctmi RNA ‐interest − Ctmi RNA ‐451), with an arbitrary zero point, so that each unit measures a 2‐fold change. The fold changes among HE, non‐HE, and normal control group are displayed below each miRNA along with the P‐values.