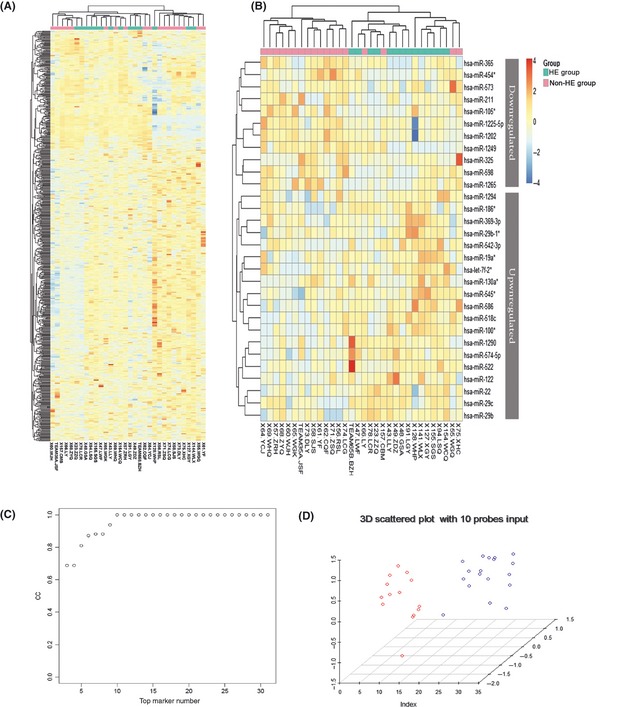
Figure 2.

Hierarchical Cluster Heatmap of circulating miRNAs and classification results using a trained support vector machine (SVM) in patients with or without hematoma enlargement (HE) after ICH. Note: Unsupervised hierarchical clustering of expression level of the overall probe miRNAs on the microarray (A) or 30 most dysregulated miRNAs (B) were carried out by using the Euclidian distance measure. HE patients (n = 14) and control subjects (n = 18) cluster separately with only four outliers in the analysis with 30 probes, showing that distinct miRNA patterns were unique for cases and controls, respectively. The miRNAs represented in the heat map are listed in Supplementary Table 2 and Table 2. (C) The classification accuracy reaches 100%, when a subset of 10 miRNAs with the lowest P‐value is added to the SVM model in a forward manner according to the P‐value and growing trends. (D) A 3D scattered plot shows that the total 32 ICH patients with or without HE were completely separated into two groups, leading to an accuracy of 100%.
