
Figure 6.
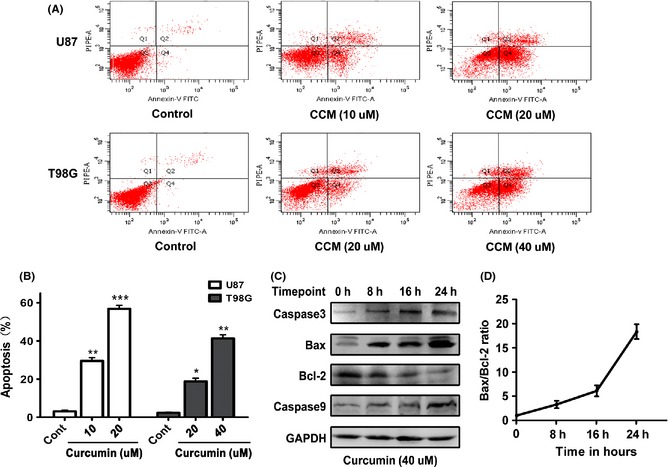
Curcumin triggered apoptosis through the internal pathway in glioma cells. (A) Subconfluent cells were either solvent DMSO‐treated (Con) or challenged with the indicated concentrations of curcumin for 24 h, and then, cell apoptosis was examined by flow cytometry assay using the Annexin V/PI. A representative experiment of the three replicated assays is shown. (B) Histogram representing dose‐dependent apoptosis of the U87 and T98G cell lines. Data are mean ± SEM of three replicates. *P < 0.05; **P < 0.01; ***P < 0.001. (C) The T98G cells were treated with 40 uM curcumin for the indicated periods of time, and then, cell extracts were prepared and used for Western blot assay using the indicated antibodies. Results showed that Bcl‐2 decreased following the increasing time points. Others were increased in a time‐dependent style. (D) Graph showing the Bax/Bcl‐2 ratio. Error bars represent standard error of three different experiments.