Figure 1.

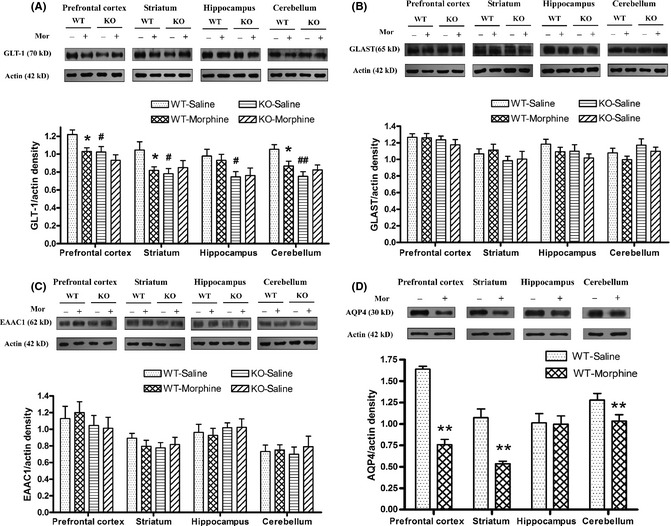
Effects of repeated morphine treatment (30 mg/kg, s.c., t.i.d., 5 days) on the expression of GLT‐1 (A), GLAST (B), EAAC1 (C), and AQP4 (D) in the prefrontal cortex, striatum, hippocampus, and cerebellum of wild‐type (WT) and AQP4 knockout (KO) mice. Data are expressed as mean ± SEM. (n = 6–10 per group). *P < 0.05, **P < 0.01 versus WT‐saline group, # P < 0.05 versus WT‐saline group, two‐way anova followed by Bonferroni post hoc test or t‐test.
