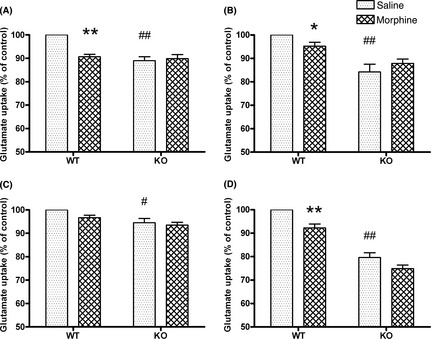
Figure 2.

[3 H] glutamate uptake after repeated morphine treatment (30 mg/kg, s.c., t.i.d., 5 days) in the prefrontal cortex (A), striatum (B), hippocampus (C), and cerebellum (D) of wild‐type (WT) and AQP4 (KO) knockout mice. Data are expressed as mean ± SEM. (n = 5 per group). *P < 0.05, **P < 0.01 versus WT‐saline group, # P < 0.05, ## P < 0.01 versus WT‐saline group, two‐way anova followed by Bonferroni post hoc test.
