Figure 3.

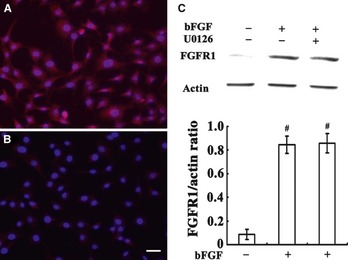
Effect of bFGF on the expression of FGFR1 in C17.2 NSCs. Panel A, B, ICC staining of FGFR1 in C17.2 NSCs. Panel B, increased expression of FGFR1 after bFGF treatment. Panel C, Western blots for FGFR1 expression showing the average densitometric values after β‐actin normalization represents the protein levels for each data point (n = 3). #P < 0.001 compared to untreated group. Scale bar, 30 μm. bFGF, basic fibroblast growth factor; ICC, immunocytochemistry; NSC, neural stem cell.
