Figure 2.

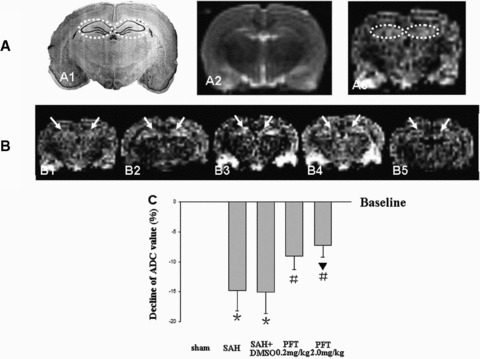
DWI and ADC value analysis. Figure A1 was a typical schematic figure of the rat hippocampus (interaural, 5.86 mm; Bregma, –3.14 mm; dotted circles). A2 and A3, same section level as A1, were the example images of T2WI and DWI in the sham rat to exclude the additional injury (Figure A2) and determine the bilateral hippocampi as the ROI (Figure A3, dotted circles). The DWI signal intensity of ROI was increased following SAH, which indicated that there was significant cytotoxic edema in the hippocampus (Figure B1–B3). The treatment with PFT‐α could markedly decrease the signal intensity (Figures B4 and B5). The average ADC value of ROI was markedly decreased following SAH compared with that of the sham group (baseline), which also indicated the development of cytotoxic edema. PFT‐α (2.0 mg/kg) showed more efficiency than 0.2 mg/kg dose on restoring the ADC values of the bilateral hippocampi (Figure C). The “arrows” in Figure B showed the bilateral hippocampus (ROI). In Figure C, *P < 0.05 versus sham group; #P < 0.05 versus SAH and SAH + DMSO groups; ▴P < 0.05 versus PFT‐α (0.2 mg/kg) group.
