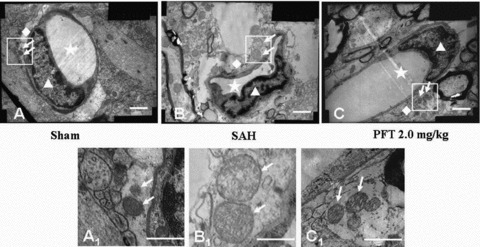
Figure 3.

The ultrastructural alterations of the astrocyte end feet. The Figures A1, B1, and C1 were the magnification of the square area in Figures A, B, and C. In the sham group, the distribution of organelles was comparatively compact and the crests of the mitochondria in the astrocyte end feet were intact and orderly (Figures A and A1). Following SAH, the volume of the end feet was increased, the wall of the microvessel was compressed by the swelling end feet. The organelles in the end feet were distributed loosely and lost the regular morphology. The volume of mitochondria was significantly increased and the arrangement of the mitochondria crests was irregular, even broken down (Figures B and B1). After PFT‐α (2.0 mg/kg) treatment, although the organelles of the end feet were still loosely distributed, the volumes of the end feet and mitochondria were significantly decreased compared with those of SAH group (Figures C and C1). Scale bars = 1 μm in A, B, C; scale bars = 0.5 μm in A1, B1, C1. The “stars” indicated the lumens of microvessels; the “triangles” showed the endothelial cells; the “rhombuses” indicated the end feet of astrocytes terminated on the microvessel walls; the “arrows” showed the mitochondria in the end feet.
