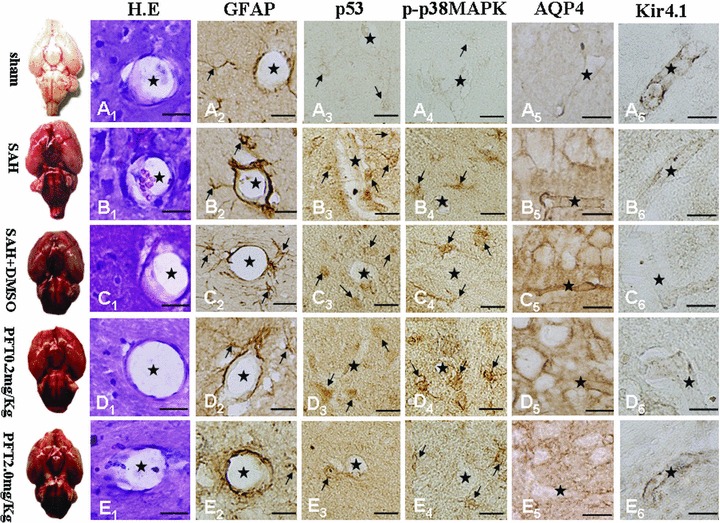
Figure 4.

Immunohistochemical images of hippocampal microvasculature. H.E staining failed to demonstrate morphological changes among the five groups (Figure A1–E1). Expressions of GFAP, p53, and phosphorylated‐p38MAPK within the astrocytes lining the microvessels following SAH were significantly increased (Figure A2–D4); PFT‐α (2.0 mg/kg) attenuated the p53 and phosphorylated‐p38MAPK staining intensity more than PFT‐α (0.2 mg/kg) therapy (Figure D3–E4). Expression of GFAP could not be altered by PFT‐α (Figures D2 and E2). Expressions of both AQP4 and Kir4.1 were predominantly found on the blood vessel walls (Figure A5–E6). AQP4 levels were significantly increased (Figures B5 and C5) whereas Kir4.1 protein showed a marked decline (Figures B6 and C6) in the SAH and SAH + DMSO groups, which could be reversed by PFT‐α therapy (Figure D5–E6). Scale bars = 20μm. “Stars” indicated microvessels; “arrows” showed the astrocytes.
