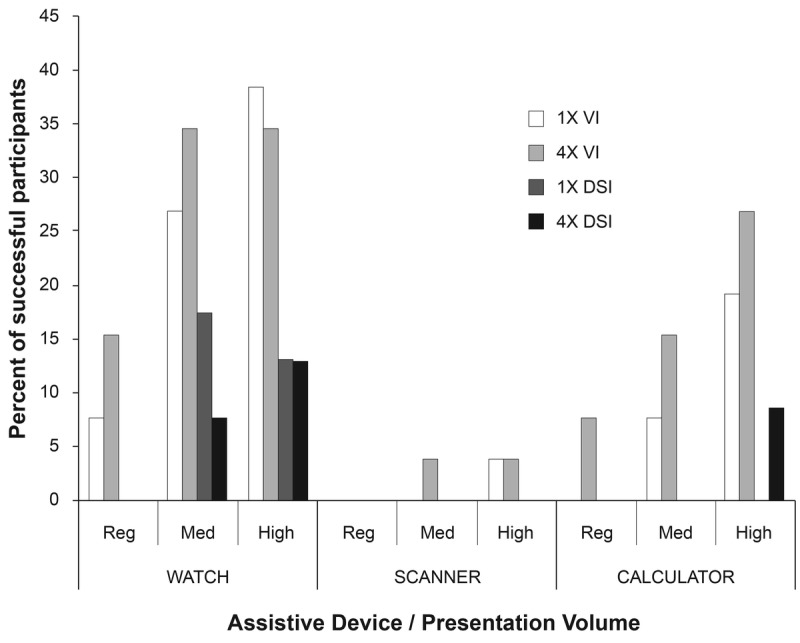
FIGURE 1.

Proportion of visually impaired and dual-impaired participants who could complete at least one of the tasks without mistakes. Success increased with increasing volume and with increasing repetition; however, overall success rates were extremely low and never exceeded 40%. 1× = one stimulus presentation; 4× = four stimulus presentations; DSI = dual sensory impairment; VI = visual impairment.
