
FIGURE 2.
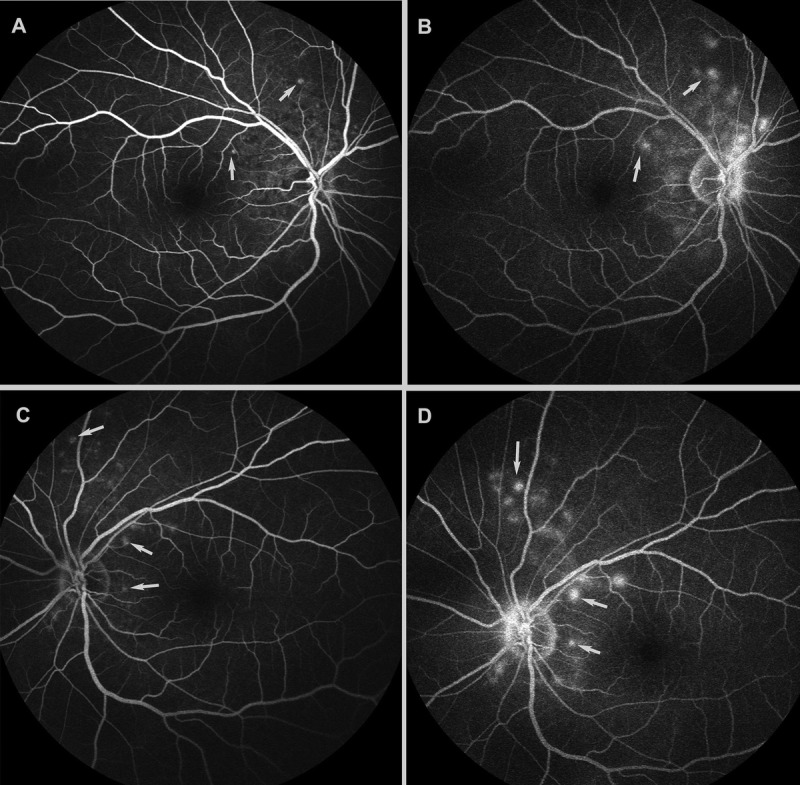
(A) Fundus fluorescein angiography showed scattered-dot hypofluorescence and needle-like early-stage hyperfluorescence (arrow) around the disc in the right eye. (B) Late-stage fluorescein leakage (arrow) in the right eye. (C) Fundus fluorescein angiography showed needle-like early-stage hyperfluorescence (arrow) around the disc in the left eye. (D) Late-stage fluorescein leakage (arrow) in the left eye.