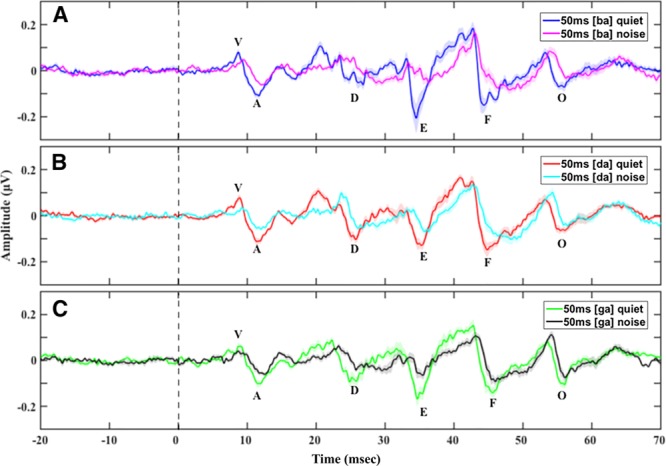
Fig. 3.

Grand average speech-auditory brainstem responses (ABRs) with prestimulus baseline in quiet and in noise to the (A) 50 msec [ba], (B) 50 msec [da], and (C) 50 msec [ga] showing longer peak latencies and smaller peak amplitudes in noise compared with in quiet across the three consonant–vowels (CVs). Shade in all panels represents 1 SE.
