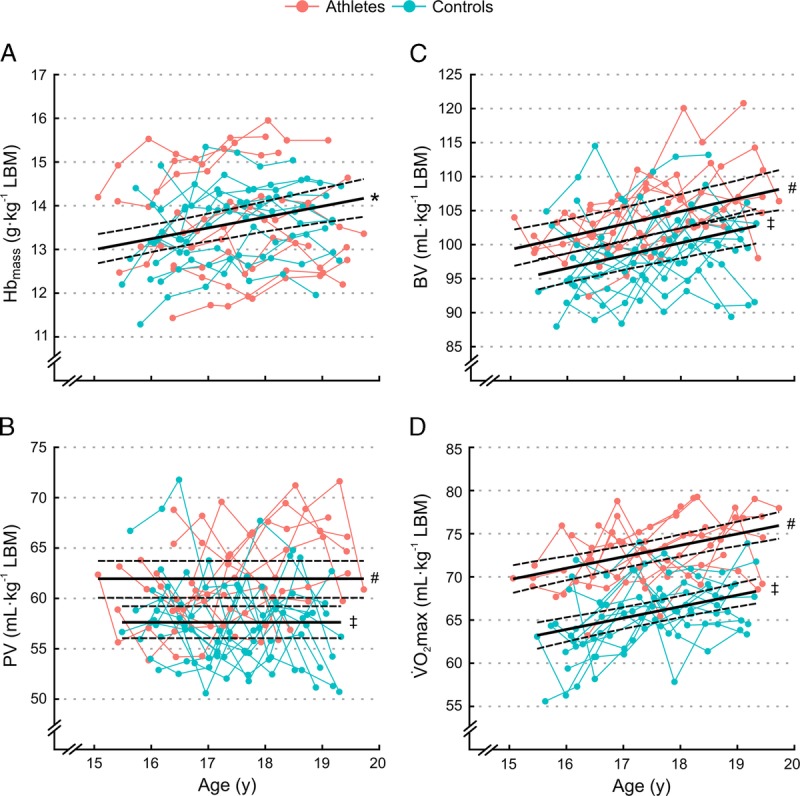
FIGURE 1.

Individual development of (A) Hbmass, (B) PV, (C) BV, and (D) V˙O2max over the 3-yr study period for athletes (red) and controls (blue). Solid lines indicate the fixed effect of age with 90% confidence limits (dashed lines) for either both groups combined (*; combined fixed effect), or for athletes (#), and controls (‡) separately.
