Figure 1.

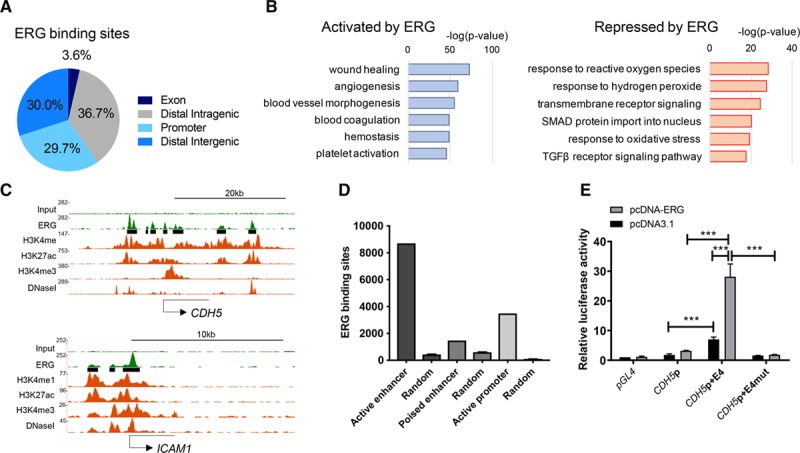
Characterization of ERG (ETS-related gene)-bound enhancers in human umbilical vein endothelial cells (HUVEC). A, Percentage genomic distribution of ERG chromatin immunoprecipitation with deep sequencing (ChIP-seq) peaks. B, Gene ontology analysis showing pathways associated with differentially regulated ERG-bound endothelial target genes (genes activated in blue and genes repressed in red). Significance shown as –log (P value). C, ChIP-seq binding profiles for ERG, H3K4me1, H3K27ac, H3K4me3, and DNase I hypersensitivity in HUVEC; loci of ERG-activated CDH5 (VE-cadherin; top) and ERG-repressed ICAM1 (bottom). The x axis represents the genomic position; the y axis the ChIP-seq signal in reads per million per base pair (rpm/bp). ERG-binding sites are shown as black bars. D, Number of ERG-binding sites associated with specific epigenomic features vs size-matched random regions. Active enhancers are defined by combined H3K4me1 and H3K27ac, poised enhancers by H3K4me1 and H3K27me3, and active promoters by H3K4me3 and H3K27ac. E, Luciferase reporter plasmids (pGL4) containing the CDH5 promoter with or without region E4 or a mutant enhancer (E4mut) were cotransfected into HUVEC along with an ERG cDNA expression plasmid (pcDNA-ERG) or empty vector control, pcDNA3.1. Values are represented as the fold change in relative luciferase activity over the empty vector alone. Values are mean±SEM, n=3. A 2-way ANOVA showed significance (P<0.001) and a post hoc test using Tukey multiple comparisons test shows pairwise differences between specific groups, ***P<0.001. TGF indicates transforming growth factor.
