Figure 4.

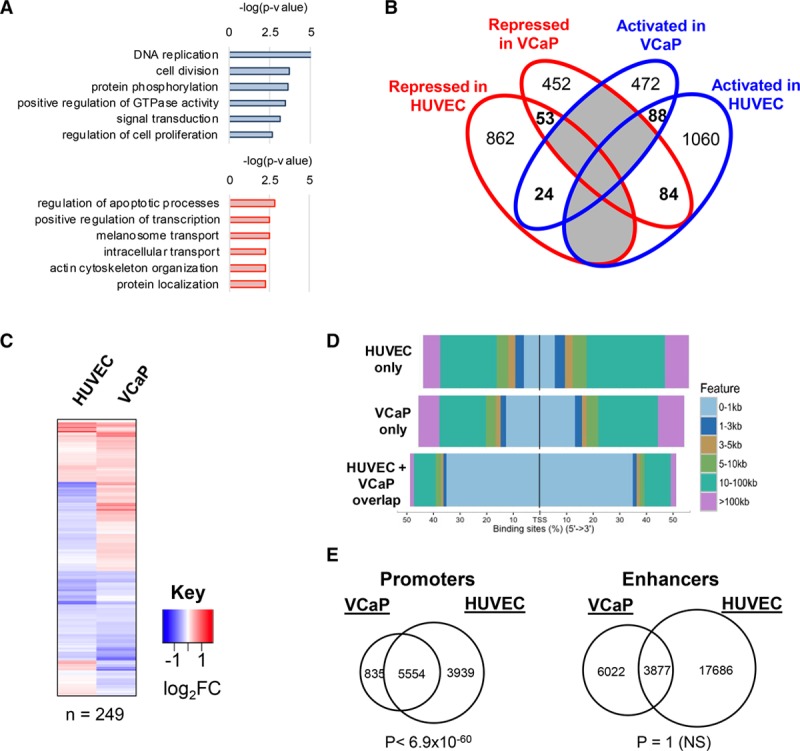
Chromatin immunoprecipitation with deep sequencing analysis identifies a lineage-specific program for ERG (ETS-related gene): ERG expression and binding profile in prostate cancer cells. A, Gene ontology pathway analysis of differentially regulated ERG-bound target genes in human prostate epithelial cancer cell line (VCaP) prostate cancer cells (activated genes in blue and repressed genes in red). Significance of pathway enrichment as −log (P value). B, Venn diagram comparing ERG bound, differentially regulated genes in human umbilical vein endothelial cell (HUVEC) and VCaP cells. Only 249 genes (in bold) are common to the 2 cell types. None of the fractions overlap significantly between the 2-way comparisons using a hypergeometric distribution test. C, Heatmap of expression levels of the shared 249 bound and regulated putative ERG target genes following ERG inhibition in HUVEC and in VCaP cells. D, Genomic view of percentage distribution of ERG peaks relative to transcription start site (TSS) in regions bound by ERG that are shared between HUVEC and VCaP cells, HUVEC only, or VCaP cells only. E, Overlap of ERG-binding sites at H3K4me3-enriched and RefSeq assigned TSS promoter regions (left), and H3K27ac/H3K4me1-enriched enhancers (right), in HUVEC and VCaP cells. Significance reported by a hypergeometric test P value. NS indicates not significant.
