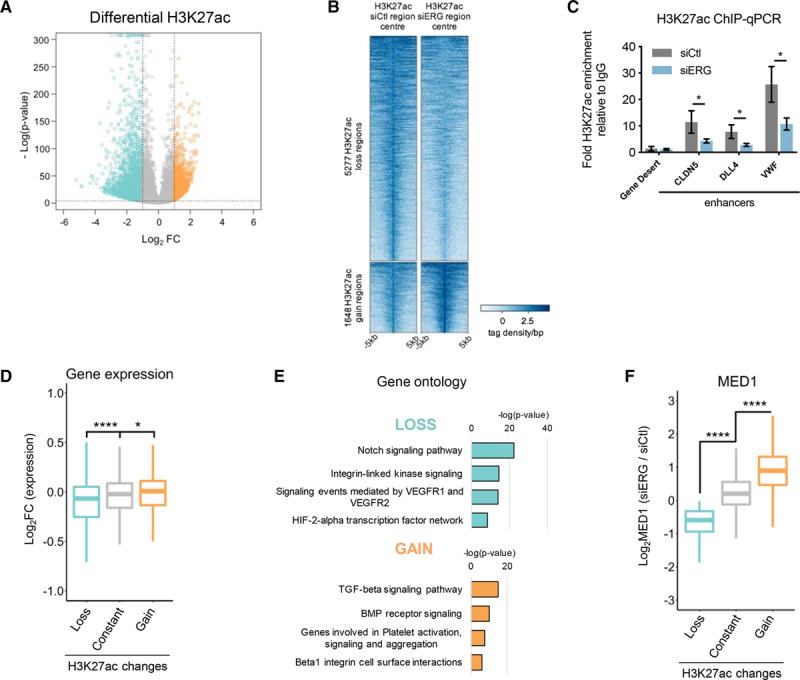
Figure 6.

ERG (ETS-related gene) contributes to enhancer activation in human umbilical vein endothelial cell (HUVEC). A, Volcano plot showing log2 fold change (FC) vs –log (P value) of differential H3K27ac enrichment at siCtl H3K27ac regions in response to ERG knockdown. Loss and gain enhancer regions are selected by −1≥log2FC≥1; −log (P value)≥4. B, Heatmap of H3K27ac enrichment over input in all loss and gain regions. Signal ±5 kb from the center of H3K27ac siCtl or siERG regions as tag density/bp. C, Chromatin immunoprecipitation-quantitative polymerase chain reaction (ChIP-qPCR) of H3K27ac at enhancers of CLDN5 (claudin-5), DLL4 (Delta-like protein 4), and VWF (von Willebrand factor) with a negative control gene desert, in siCtl vs siERG-treated HUVEC. Graph represents fold change over IgG, n=3. *P<0.05, paired 2-tailed t test. D, Boxplot representing log2FC from transcriptome profiling data following ERG knockdown in H3K27ac regions changed in response to siERG (as defined in A). P<0.0001, Kruskal-Wallis test and post hoc test using Wilcoxon rank-sum test, ****P<0.0001; *P<0.05. E, Pathway analysis of genes associated with loss and gain of H3K27ac. F, Boxplot showing the log2FC of MED (Mediator complex subunit)-1 occupancy in siERG-treated HUVEC in H3K27ac regions changed in response to siERG. P<0.0001, Kruskal-Wallis test and post hoc test using Wilcoxon rank-sum test, ****P<0.0001. TGF indicates transforming growth factor. BMP indicates bone morphogenetic protein; HIF, hypoxia inducible factor; TGF, transforming growth factor; and VEGFR, vascular endothelial growth factor receptor.
