
Figure 5.
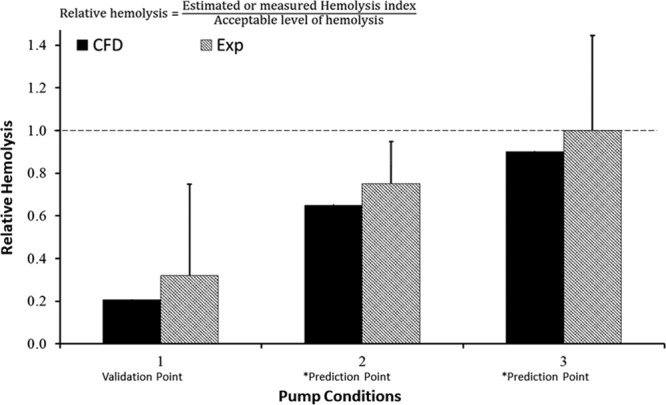
Hemolysis results for COU1 at the validation point and the two prediction points. As outlined in Figure 2A, the CFD results for pump conditions 2 and 3 are model predictions, as marked by the asterisk. The dashed line represents an RH of 1 based on a predicate comparison. Please note that the experimental and CFD data presented here are hypothetical and used only to demonstrate the credibility assessment process.