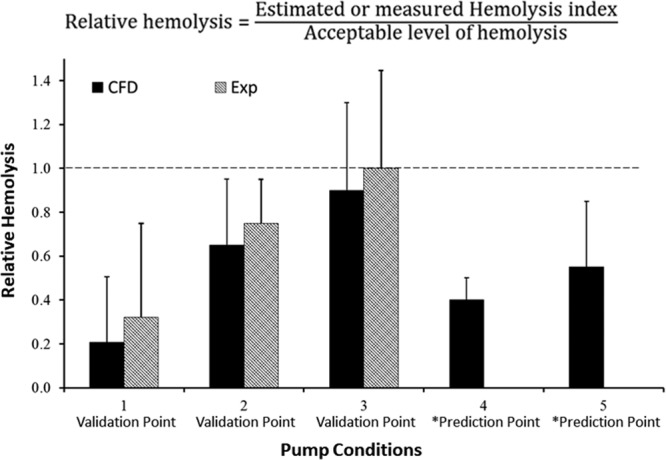
Figure 6.

Hemolysis results for COU2 at the three validation points and the two prediction points, as marked by the asterisk. As outlined in Figure 2B, the CFD results for pump conditions 4 and 5 are model predictions. The dashed line represents the RH of 1, which is based on a comparison to an approved pump with adequate performance. Please note that the experimental and CFD data presented here are hypothetical and used only to demonstrate the credibility assessment process.
