
Fig 1.
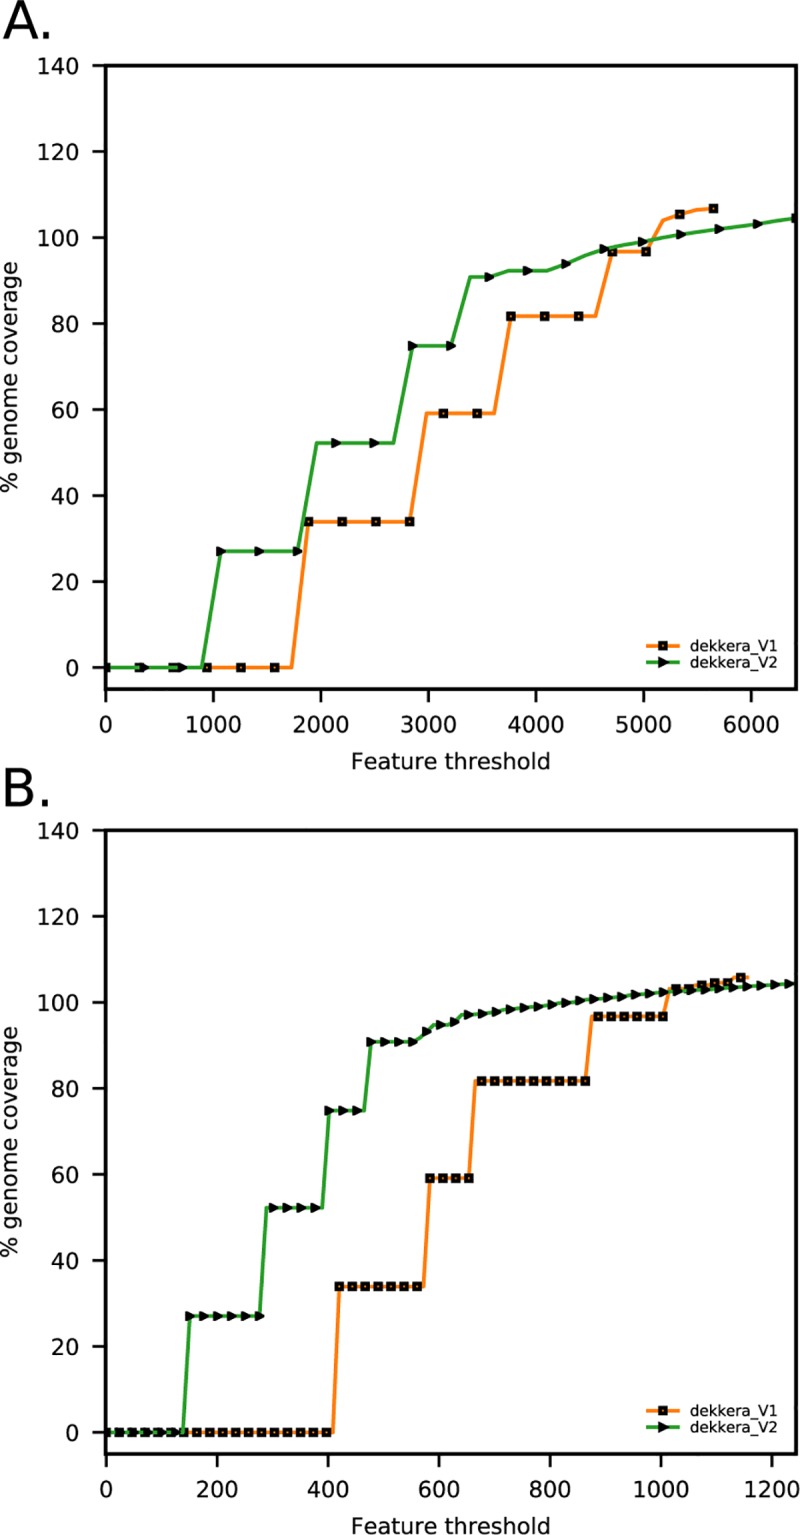
Feature response curves (FRC) computed for all features (A) and low coverage features (B) (adapted from [32]). FRC are shown for HGAP, allpaths, dekkera_V1 (final assembly presented in [32]) and dekkera_V2 (assembly presented in this work). The decreased amount of features when removing the duplicated fragment of chromosome 1 in dekkera_V1 assembly is mostly attributed to the loss of regions below normal read coverage (B). Such regions are often indicative of incorrect repeat expansions made by the assembly program [32].