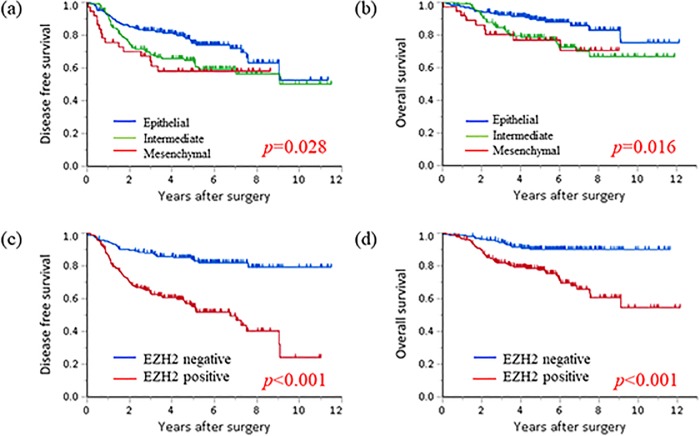
Fig 3. Kaplan–Meier survival curves according to EMT phenotypes and EZH2 expression.
The Intermediate and Mesenchymal groups were associated with poor disease-free (a) (DFS: p = 0.028) and overall (b) (OS: p = 0.016) survival. Furthermore, positive EZH2 staining was also associated with poor disease-free (c) (p<0.001) and overall (d) survival (p<0.001).

