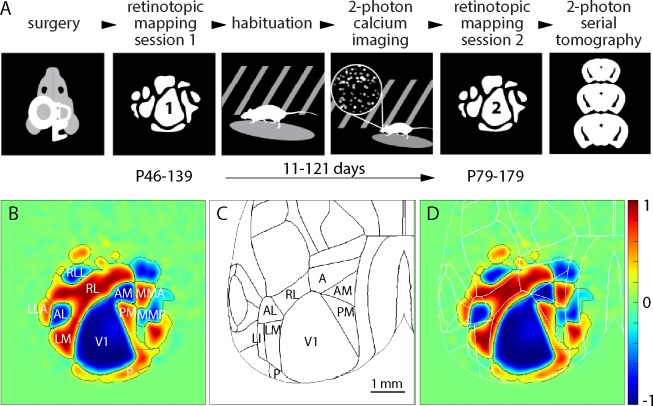
Fig 1. Repeated retinotopic mapping of mouse cortical areas.
(A) Workflow of the Allen Brain Observatory, including implantation of a 5 mm diameter cranial window and retinotopic mapping at two time points, separated by 11–121 days. (B) Mean field sign map from 60 mice, with borders and labels for the 11 visual areas studied here. (C) Borders of cortical areas in the 3D Allen Mouse Brain Reference Atlas. Visual areas are labeled. (D) Mean sign map aligned to the 3D Allen Mouse Brain Reference Atlas, with atlas borders in white. The color scale bar applies to all field sign maps throughout the paper.

