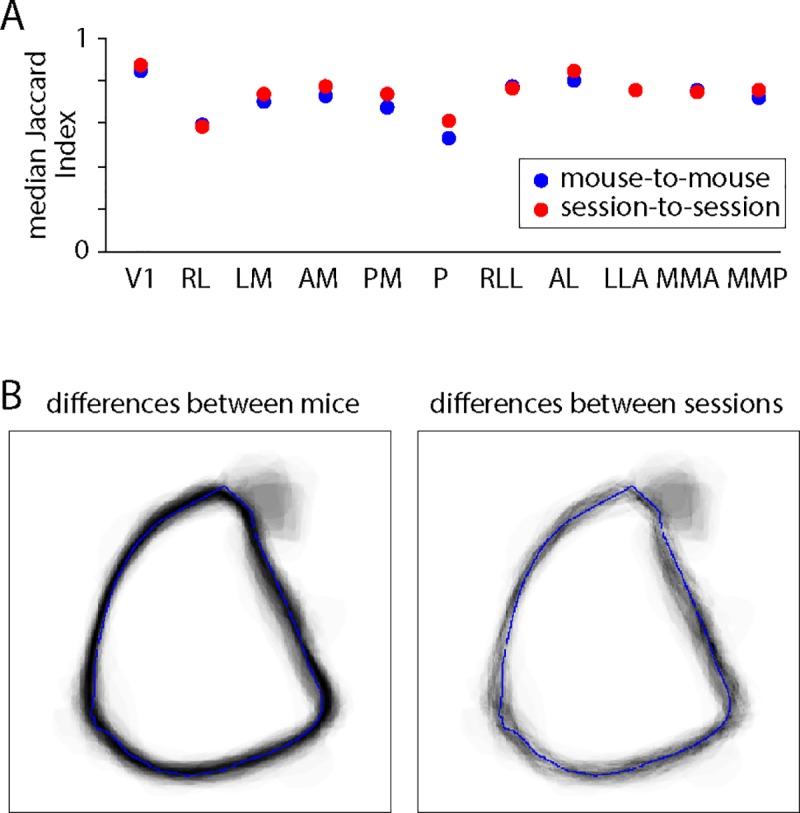
Fig 5. Biological variation in the shapes of field sign patches.

(A) Median of the distribution of the Jaccard Indices for mouse-to-mouse and session-to-session comparisons, for each patch. (B) Cumulative differences in V1 for mouse-to-mouse and session-to-session pairwise comparisons.
