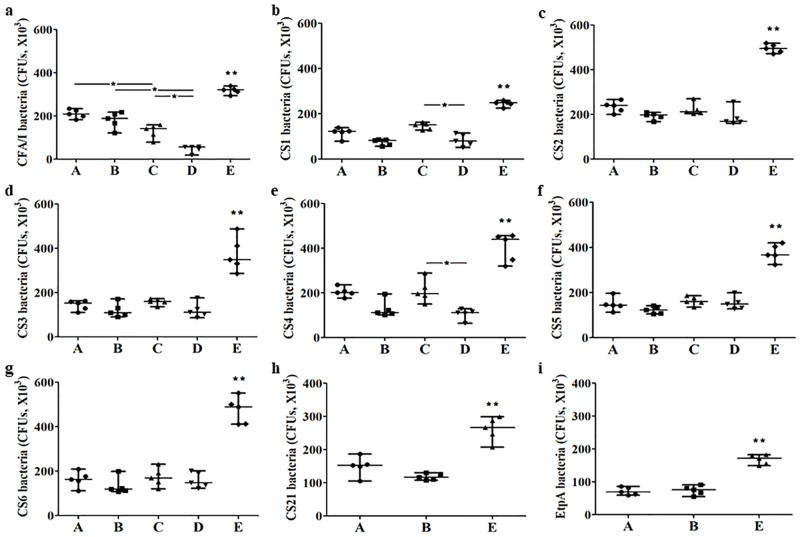
Fig 3. In vitro mouse serum antibody adherence inhibition assays from the groups subcutaneously immunized with tip MEFA alone (A), tip MEFA combined with toxoid fusion 3xSTaN12S-mnLTR192G/L211A (B), major subunit CFA/I/II/IV MEFA alone (C), major subunit CFA/I/II/IV MEFA combined with toxoid fusion 3xSTaN12S-mnLTR192G/L211A (D), or the control group (E).
The line in each group represents the median number of each bacteria expressing CFA/I (panel a), CS1 (panel b), CS2 (panel c), CS3 (panel d), CS4/CS6 (panel e), CS5/CS6 (panel f), CS6 (panel g), CS21 (panel h) or EtpA (panel i) adhesin (CFUs) adherent to Caco-2 cells. Data were analyzed using Kruskal-Wallis test, followed by Dunn’s pairwise comparison. * indicates a p-value of <0.05, and ** refers a p-value of <0.01 (comparison between the control group and any of the immunization groups).

