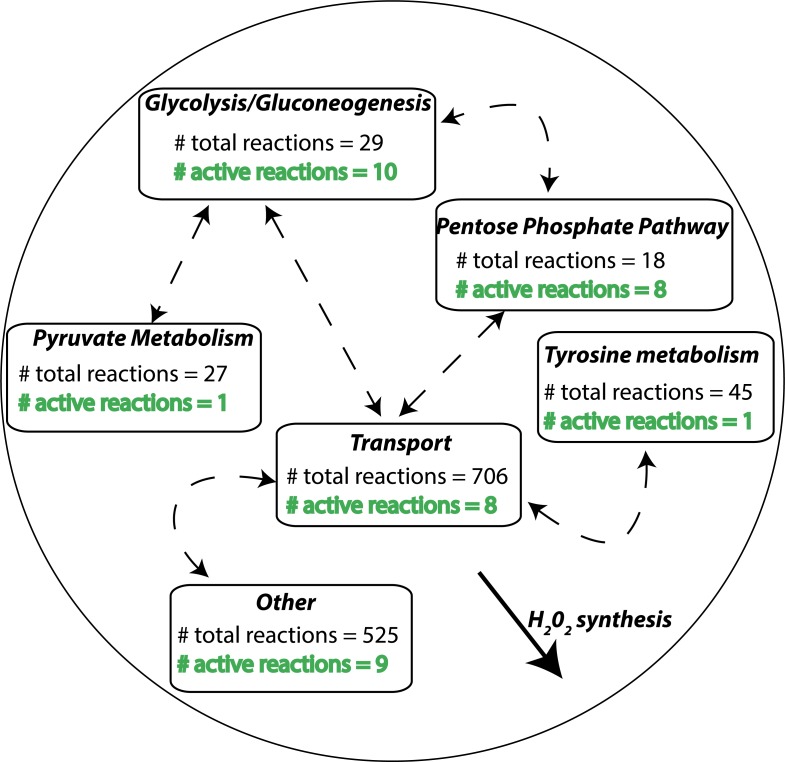
Fig 1. A minimal network (MiN) and high-frequency reactions (HFRs).
A MiN of H2O2 synthesis is illustrated. Each box represents a different metabolic subsystem/pathway. The number of total reactions listed in each box represents the annotated reactions for that subsystem. Active reactions carry non-zero flux, and the number of these present in each subsystem is shown in green text.

