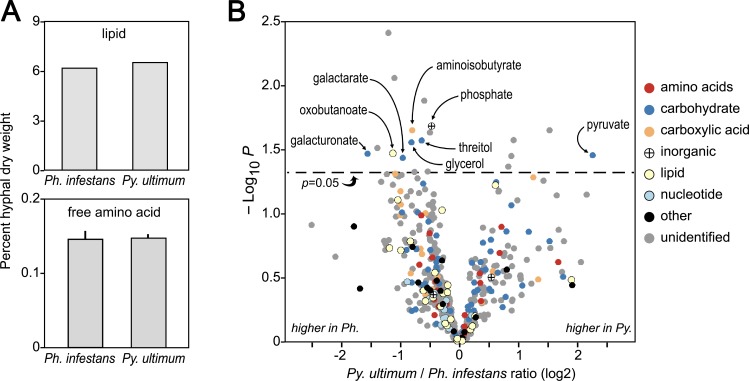
Fig 3. Comparison of metabolite levels in Ph. infestans and Py. ultimum hyphae.
(A) Levels of total lipid and free amino acids in hyphae from rye media. (B) Volcano plot comparing metabolite levels. The X-axis indicates the ratio of the abundance in Py. ultimum compared to Ph. infestans, based on 12 biological replicates. The Y-axis indicates the P-value for differential expression, uncorrected for false discovery due to multiple testing. Marked above the dotted lines are compounds differentially present at P<0.05. Compounds are color-coded by category, with unidentified compounds shown in gray.

