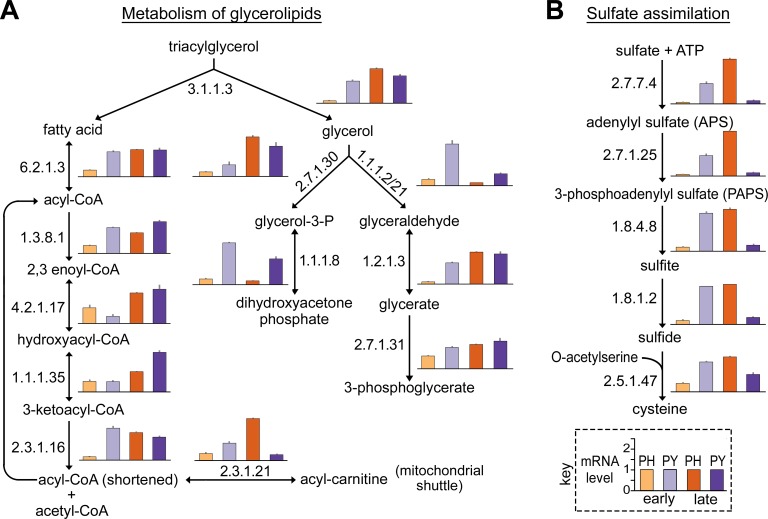
Fig 5. Expression of Ph. infestans and Py. ultimum genes involved in glycerolipid metabolism and sulfate assimilation during tuber infection.
(A) Relative mRNA levels of genes involved in glycerolipid metabolism, starting from the cleavage of a triacylglycerol into glycerol and fatty acids. Enzyme Commission protein 2.3.1.21 is part of the carnitine shuttle that moves cytoplasmic acyl-CoA into the mitochondria. (B) Genes involved in the assimilation of inorganic sulfate. In both panels, the samples in the bar graphs are indicated in the key, and continue the color scheme and sample orders used in Fig 3. The y-axis in each bar graph represents relative mRNA levels, per-gene normalized to an average of 1.0 for all four samples, as indicated in the key. Indicated in the pathway is each metabolite and the Enzyme Commission (EC) number for each enzyme.

