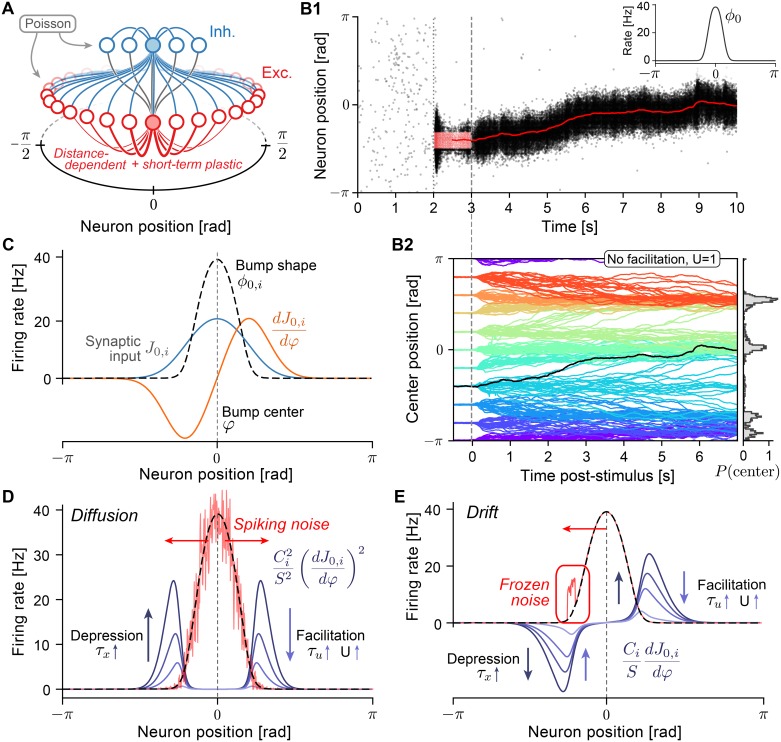
Fig 1. Drift and diffusion in ring-attractor models with short-term plasticity.
A Excitatory (E) neurons (red circles) are distributed on a ring with coordinates in [−π, π]. Excitatory-to-excitatory (E-E) connections (red lines) are distance-dependent, symmetric, and subject to short-term plasticity (facilitation and depression, see Eq (3)). Inhibitory (I) neurons (blue circles) project to all E and I neurons (blue lines) and receive connection from all E neurons (gray lines). Only outgoing connections from shaded neurons are displayed. In simulations with integrate-and-fire neurons, each neuron also receives noisy excitatory spike input generated by independent homogeneous Poisson processes. B1 Example simulation: E neurons fire asynchronously and irregularly at low rates until (dotted line) a subgroup of E neurons is stimulated (external cue), causing them to spike at elevated rates (red dots, input was centered at 0, starting at t = 2s for 1s). During and after (dashed line) the stimulus, a bump state of elevated activity forms and sustains itself after the external cue is turned off. The spatial center of the population activity is estimated from the momentary firing rates (red line, plotted from t = 2.5s onward). Inset: Activity profile in the bump state, centered at 0. B2 Center positions of 20 repeated spiking simulations for 10 different initial cue positions each for a network with short-term depression (U = 1, τx = 150ms). Random E-E connections (with connection probability p = 0.5) lead to directed drift in addition to diffusion. Right: Normalized histogram (200 bins) of final positions at time t = 13.5. C Illustration of quantities used in theoretic calculations. Neurons in the bump fire at rates ϕ0,i (dashed black line, compare to B1, inset) due to the steady-state synaptic input J0,i (blue line). Movement of the bump center causes a change of the synaptic input (orange line). D Diffusion along the attractor manifold is calculated (see Eq (5)) as a weighted sum of the neuronal firing rates in the bump state (dashed black line). Spiking noise (red line) is illustrated as a random deviation from the mean rate with variance proportional to the rate. The symmetric weighting factors (blue lines show for varying U) are non-zero at the flanks of the firing rate profile. Stronger short-term depression and weaker facilitation increase the magnitude of weighting factors. E Deterministic drift is calculated as a weighted sum (see Eq (7)) of systematic deviations of firing rates from the bump state (frozen noise): a large positive firing rate deviation in the left flank (red line) will cause movement of the center position to the left (red arrow) because the weighting factors (blue lines show for varying U) are asymmetric.

