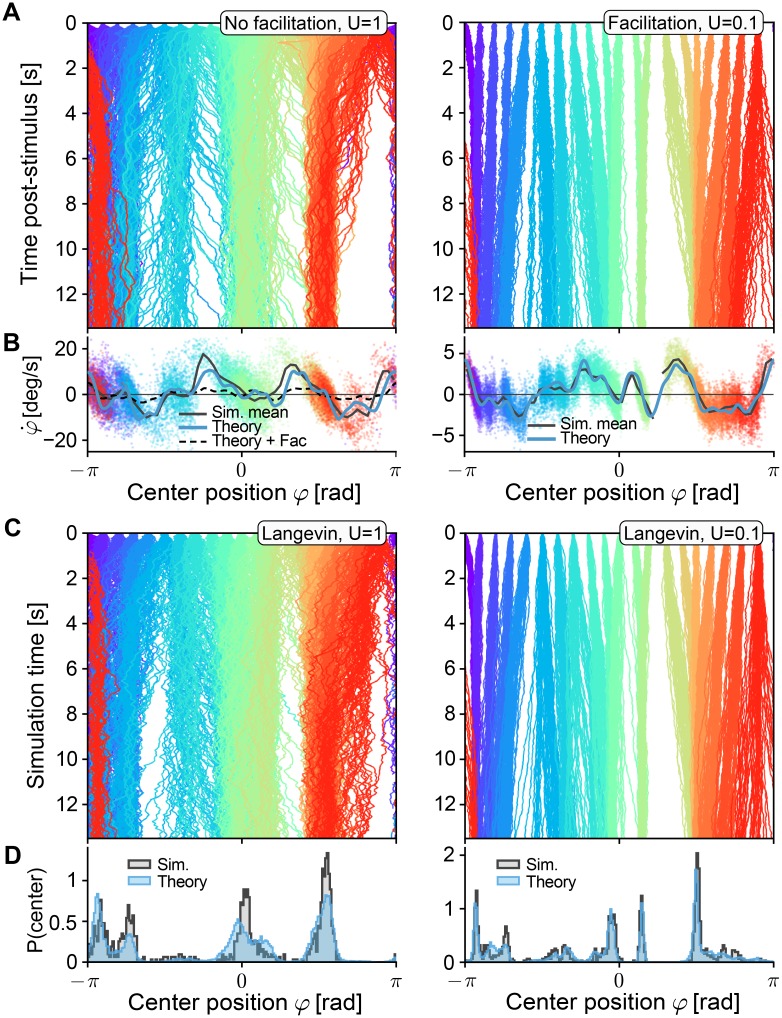
Fig 2. Drift field predictions for varying short-term facilitation.
All networks have the same instantiation of random connectivity (p = 0.5), similar to Fig 1B1. A Centers of excitatory population activity for 50 repetitions of 13.5s delay activity, for 20 different positions of initial cues (cue is turned off at t = 0) colored by position of the cues. Left: no facilitation (U = 1). Right: with facilitation (U = 0.1). B Drift field as a function of the bump position. The theoretical prediction (blue line, see Eq (7)) of the drift field is compared to velocity estimations along the trajectories shown in A, colored by the line they were estimated from. The thick black line shows the binned mean of data points in 60 bins. For comparison, the predicted drift field for U = 0.1 is plotted (thin dashed line). Left: no facilitation (U = 1), for comparison the theoretical prediction for the case U = 0.01 is plotted as a dashed line. Right: with facilitation (U = 0.01). C Trajectories under the same conditions as in A, but obtained by forward-integrating the one-dimensional Langevin equation, Eq (4). D Normalized histograms of final positions at time t = 13.5 for data from spiking simulations (gray areas, data from A) and forward solutions of the Langevin equations (blue areas, data from C). Other STP parameters were: τu = 650ms, τx = 150ms.

