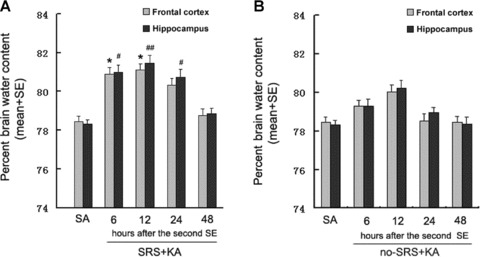
Figure 1.

(A) Brain water content after KA‐induced SE in rats with SRS. The water content (%) is significantly increased in SRS + KA group compared with SA group both in the frontal cortex (6 and 12 h after KA treatment) and in the hippocampus (6, 12, and 24 h after KA treatment). different than SA groups in the frontal cortex, *P < 0.05; different than SA group in the hippocampus, #P < 0.05, ##P < 0.01. (B) Brain water content after KA‐induced SE in rats without SRS. The water content (%) is increased but not significantly in no‐SRS + KA group compared with the SA group both in the frontal cortex and in the hippocampus. different than SA groups in the frontal cortex, P > 0.05; different than SA groups in the hippocampus, P > 0.05.
