
Figure 3.
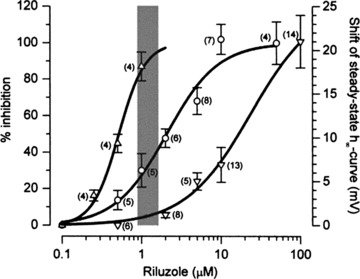
Overlaid view of the dose–response curves of riluzole on firing rate, INaP, and fast sodium current shows that decreases in firing are most likely due to inhibition of INaP. From left to right: concentration–response curves showing the effects of riluzole on firing rate (▵, left vertical axis), on INaP amplitude (○, left vertical axis), and on the shift of steady‐state inactivation curve for fast sodium current (∇, right vertical axis). The effect on firing rate was computed as the percentage ratio of the total number of events in 30 successive stimulations in tests over controls. For all concentrations INaP was recorded at the test potential of −15 mV (holding potential of −75 mV). Data relative to INaP were pooled after they had been normalized within each cell with respect to controls. For the shifts of the steady‐state inactivation curve (actually negative), absolute values are given. The gray band represents the putative plasma concentrations of riluzole [177] at the suggested therapeutic dose (2 × 50 mg/day). For all curves, data points are given as mean ± SEM, n within parentheses. Reprinted from [14], copyright (2000), with permission from John Wiley & Sons.