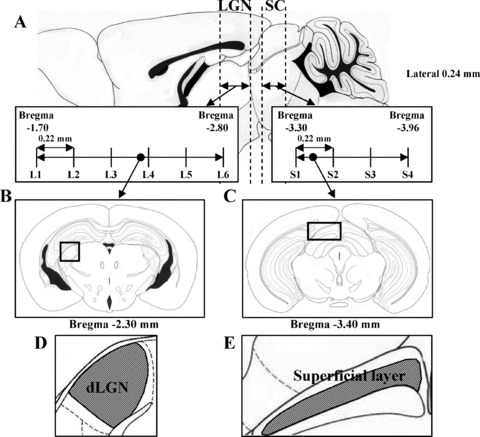
Figure 1.

Illustrations showing (A) serial coronal sections through the levels of LGN (bregma −1.70 to −2.80 mm) and SC (bregma −3.30 to −3.96 mm) in mice. Coronal sections through LGN level (bregma −2.30 mm) (B) and SC level (bregma −3.40 mm) (C) in mice [boxed areas are shown diagrammatically in (D) and (E), respectively].
