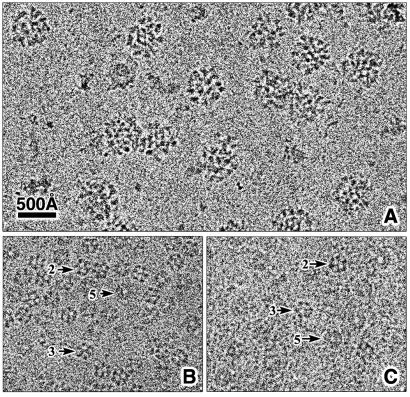
Figure 1.
CryoEM images. Fields of images of frozen-hydrated bovine PDC (A) and S. cerevisiae tE2 (residues 221–454; B) and E2 (C). The E1 molecules appear equally distributed about the scaffold, and their association with its outside increases the diameter from ≈250 to ≈500 Å. The similarity between the tE2 and E2 images indicates that N-terminal domains (residues 1 to ≈220) are flexible.

