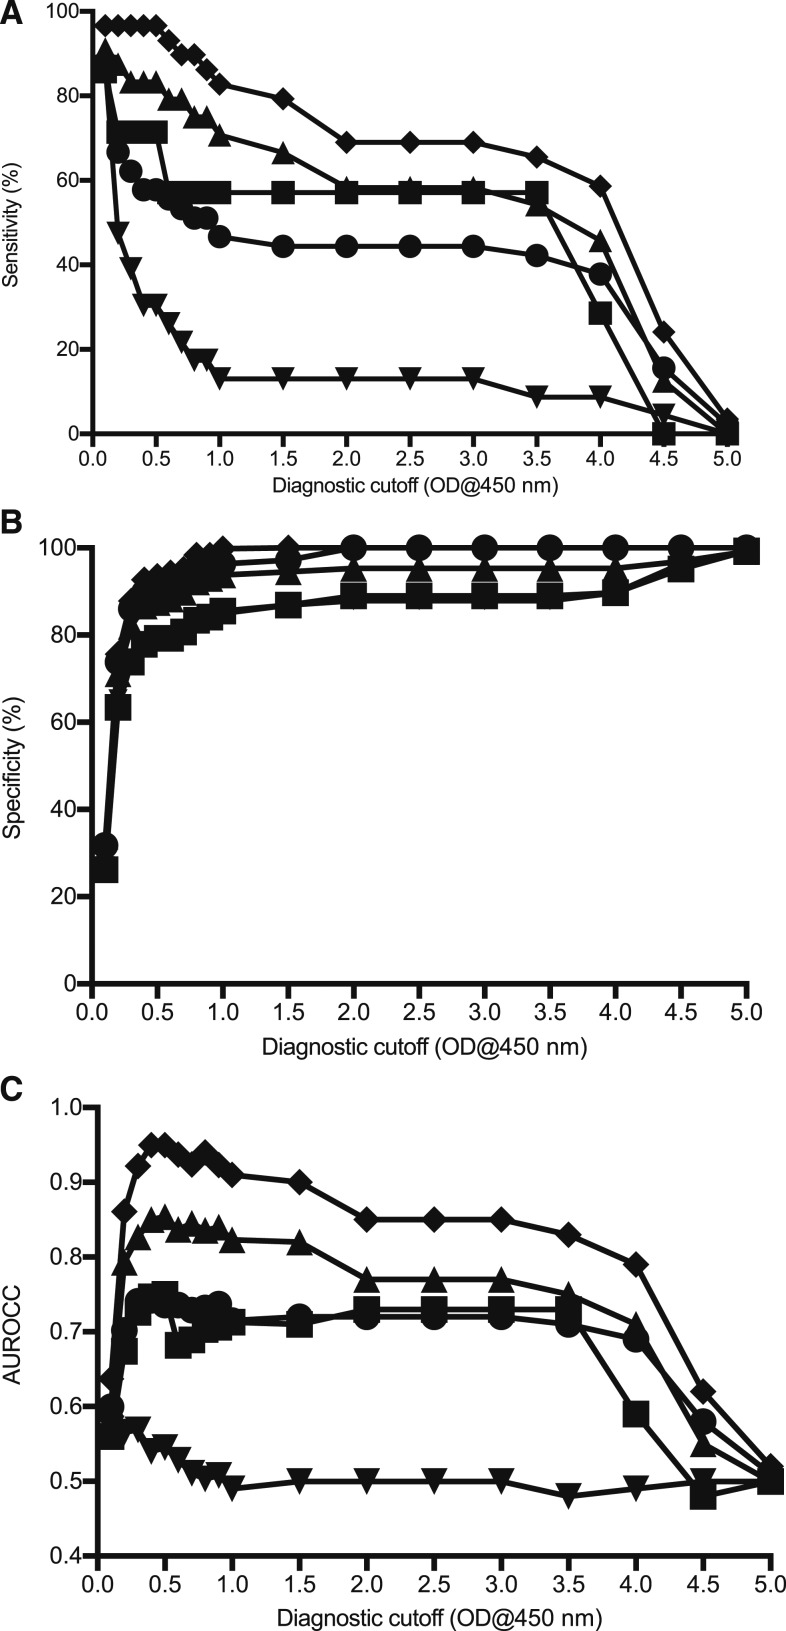
Figure 2.
Overview of admission sample over the range ELISA cutoff optical densities (ODs) plotted for various diagnostic modalities of (▲) PCR; (▪) Culture; (▼) immunofluorescence assay (IFA) adm ≥ 3,200; (♦) IFA adm ≥ 3,200 or 4-fold ≥ 3,200; (●) modified scrub typhus infection diagnostic criteria. Sensitivity (A) and specificity (B) of the ELISA cutoffs, and correlation (C) between reference test positivity and ELISA positivity are shown.

