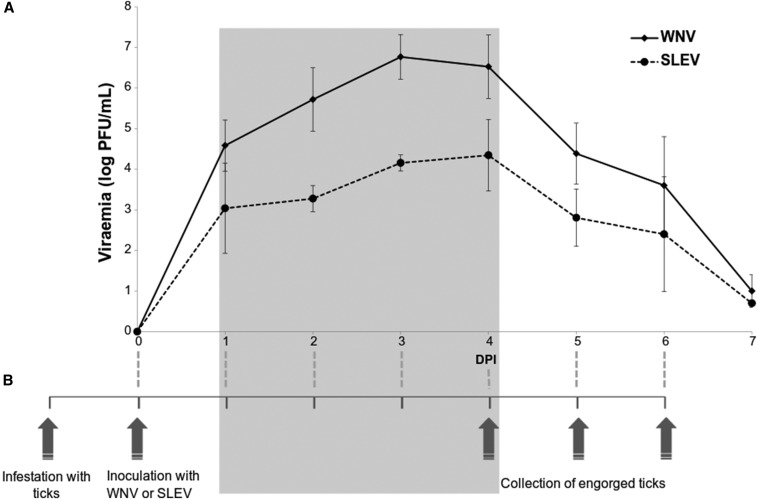
Figure 1.
(A) Viremia profile (mean and standard deviation) for West Nile virus (WNV) and St. Louis encephalitis virus (SLEV) detected in chicks subcutaneously inoculated. (B) Timeline for transmission experiments carried out on this research. The gray box shows that tick feeding occurred during the peak of viremia of the chicks. DPI = days postinoculation.

