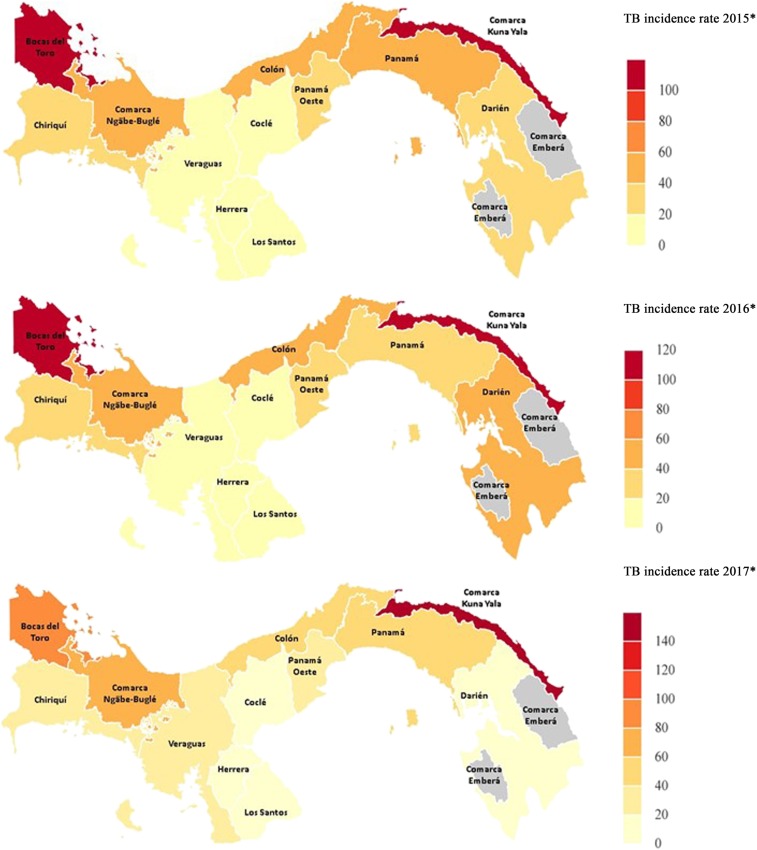
Figure 1.
Tuberculosis (TB) incidence changes in Panama during the 2015–2017 period: Country map shows the TB incidence per 100,000 inhabitants per year. Lighter colors indicate lower incidences and darker colors indicate high-incidence settings within Panama. The study site was Cocle Province. Source: Ministry of Health of the Republic of Panama. This figure appears in color at www.ajtmh.org.

