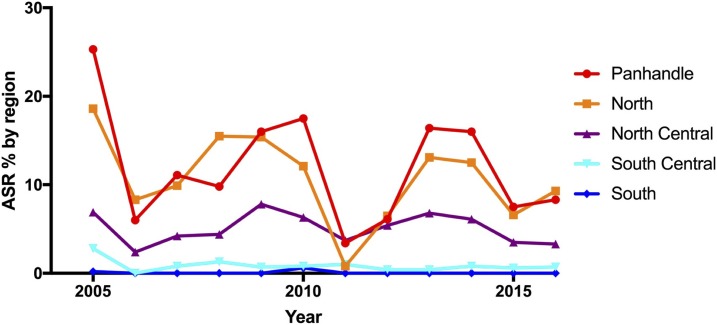
Figure 2.
Annual seroconversion rate in percent of sentinel chickens seroconverting to eastern equine encephalitis virus in Florida by region, 2005 to 2016. Annual seroconversion rate in percent (the number of confirmed chickens divided by the number of susceptible chickens bled in each year and represented as percent) for the Panhandle region in red, North region in orange, North Central region in purple, South Central region in light blue, and the South region in dark blue. This figure appears in color at www.ajtmh.org.

