Figure 6.
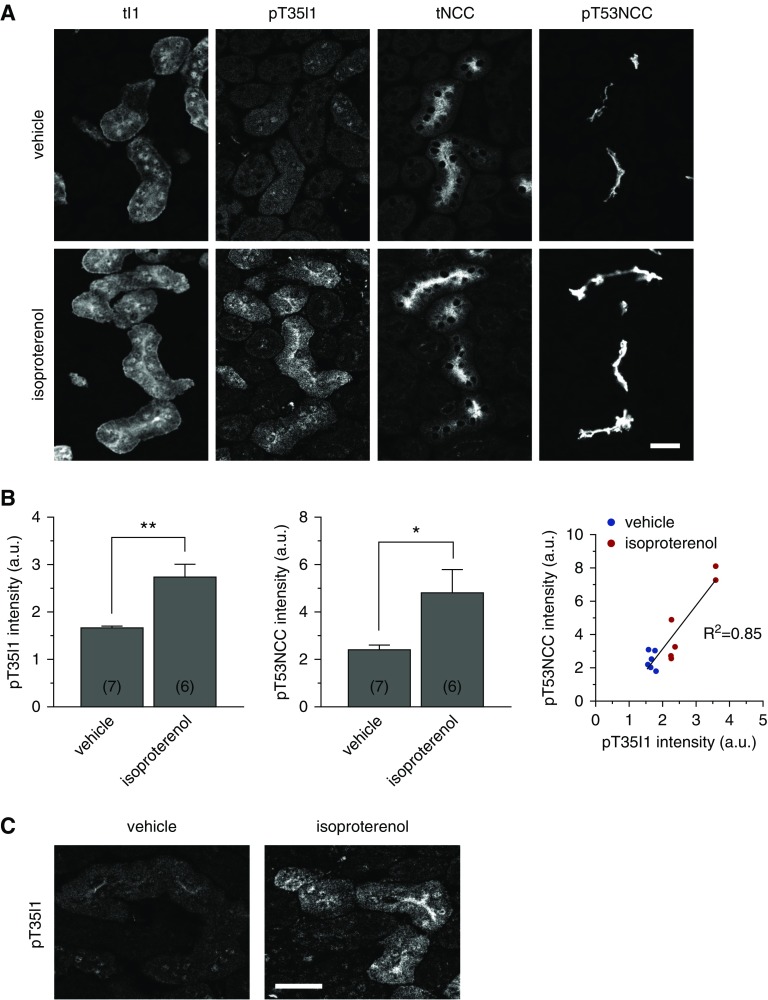
β-adrenergic stimulation promotes the phosphorylation of I1 at T35 in native DCTs. (A) Representative immunofluorescence stainings of tI1, pT35I1, tNCC, and pT53NCC in consecutive sections of kidney slices from WT mice are shown. Slices were treated with isoproterenol 100 nmol/L or vehicle (scale bar, 25 μm). (B) The graph represents the relative mean intensity of pT35I1 staining (left panel) or pT53NCC (middle panel) in 6–7 slices (in brackets) from three mice (see Supplemental Material for details). Error bars represent the SEM. *P<0.05, **P<0.01 assessed by unpaired t test. Right panel represents the linear correlation between I1 (pT35) and NCC (pT53) phosphorylation. (C) Higher magnification of typical pT35I1 staining in kidney slices treated with vehicle (left panel) and isoproterenol (right panel), highlighting its marked apical accumulation (scale bar, 25 μm).

