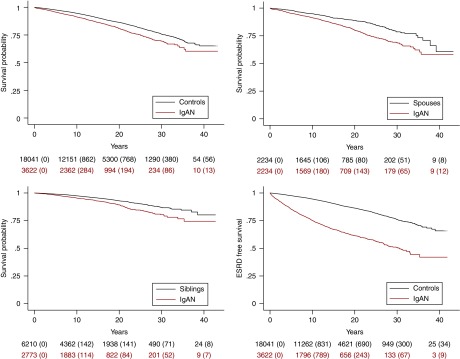
Figure 1.
Reduced patient and renal survival in IgAN patients compared to reference groups, visualized visualized through standardized Cox survival curves. Top left: patient survival of patients with IgAN compared with matched controls from the general population (TPR); P<0.001. Bottom left: patient survival of patients with IgAN compared with their siblings (Multi-Generation Register); P<0.001. Top right: patient survival of patients with IgAN compared with their spouses (the first person an IgAN patient was married to, according to the TPR); P<0.001. Bottom right: renal survival in patients with IgAN compared with matched controls (TPR); ESRD as outcome variable, death as a censoring event; P<0.001. Emigration and end of follow-up are censoring events in all analyses. Small figures indicate individuals at risk (instances of the outcome of interest within parentheses).

