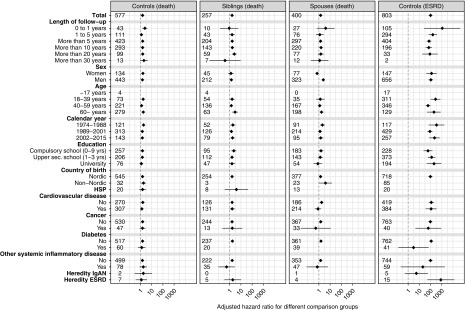
Figure 2.
Adjusted HRs for death and ESRD in patients with IgAN with subgroup stratification, showing increased mortality in IgAN compared to all reference groups, and increased ESRD compared to matched general population controls. First column: HRs for death of patients with IgAN compared with matched controls from the general population (TPR). Second column: HRs for death in of patients with IgAN compared with their siblings (Multi-Generation Register). Third column: HRs for death of patients with IgAN compared with their spouses (the first person an IgAN patient was married to, according to the TPR). Fourth column: HRs for ESRD in patients with IgAN compared with matched controls (TPR). Numbers represent absolute numbers of events in patients with IgAN. Whiskers represent 95% CIs. HSP, Henoch-Schönlein purpura.

