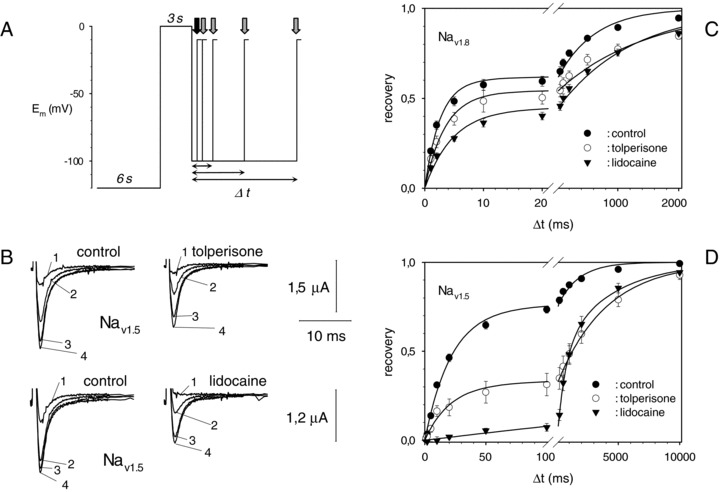
Figure 3.

Effects of tolperisone and lidocaine on recovery kinetics of sodium channels (Reprinted from Hofer et al. (2006) with permission.). (A) Voltage jump protocol that was used to elicit sodium currents: The oocyte membrane was held at −120 mV for 6 s to allow for recovery, then steady‐state inactivation was achieved using a first suprathreshold pulse. Recovery was assessed using a second suprathreshold pulse after a variable time interval at rest (arrows). (B) Original current recordings from Nav1.5 under control conditions (left) and under the influence of 100 μmol/L tolperisone (right, upper) as well as under 300 μmol/L lidocaine (right, lower). Recovery time intervals were, (1) 10 ms; (2) 500 ms; (3) 5 s, and (4) 50 s, respectively. (C) Average recovery of Nav1.8 for control conditions ( •), 100 μmol/L tolperisone (○), and 100 μmol/L lidocaine ( ). Bars represent S.E.M. Solid lines represent a biexponential fit. Time axis was split in two regions of different scaling to better visualize the domains of the fast and the slow recovery process. (D) As in C, but for Nav1.5.
