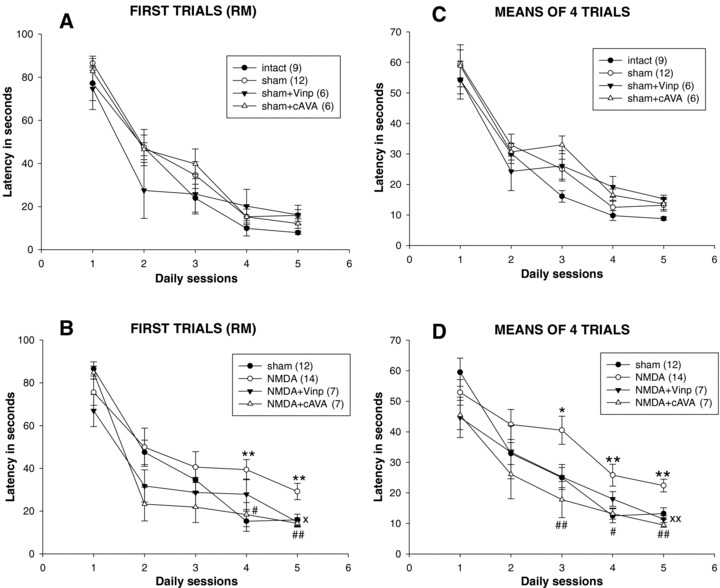
Figure 4.

Spatial learning in the Morris water maze after entorhinal cortex lesion and drug treatments (10mg/kg i.p. vinpocetine (Vinp) or cis‐apovincaminic acid (cAVA)). Upper panels (A) and (C) show the nonlesioned control groups, while panels (B) and (D) the NMDA‐lesioned ones and their sham‐lesioned controls. Panels (A) and (B) present the escape latencies of the first trials at each sessions (reference memory, RM) and panels (C) and (D) the means of four escape latencies performed in each daily session. ANOVA analyses are in the text. Post hoc test results are the followings: *P < 0.05, **P < 0.01 between NMDA versus sham animals; ×P < 0.05, ×P < 0.01 between NMDA + Vinp and NMDA groups; #P < 0.05, ##P < 0.01 between NMDA‐cAVA and NMDA groups.
