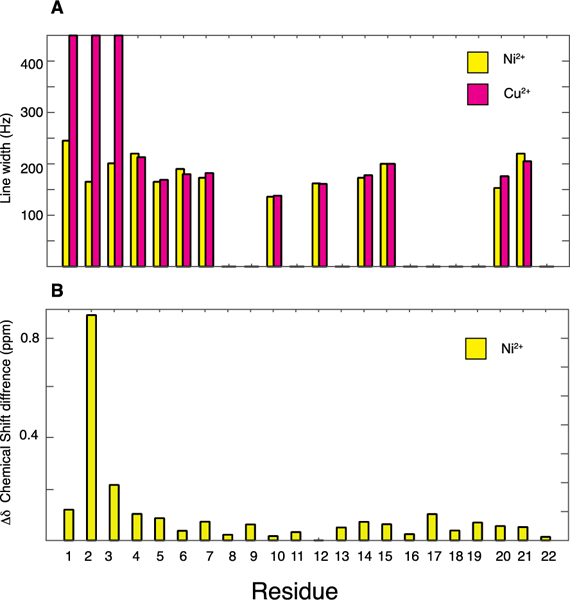
Figure 4.

(A) Comparison of line widths between Ni2+-bound (yellow) and Cu2+-bound P3 (pink). The line widths were measured from two-dimensional 13C/13C spectra obtained with a 10 ms mixing time. (B) Chemical shift perturbations (i.e. CSDs) for 13C and 15N resonances upon Ni2+ binding to P3.
