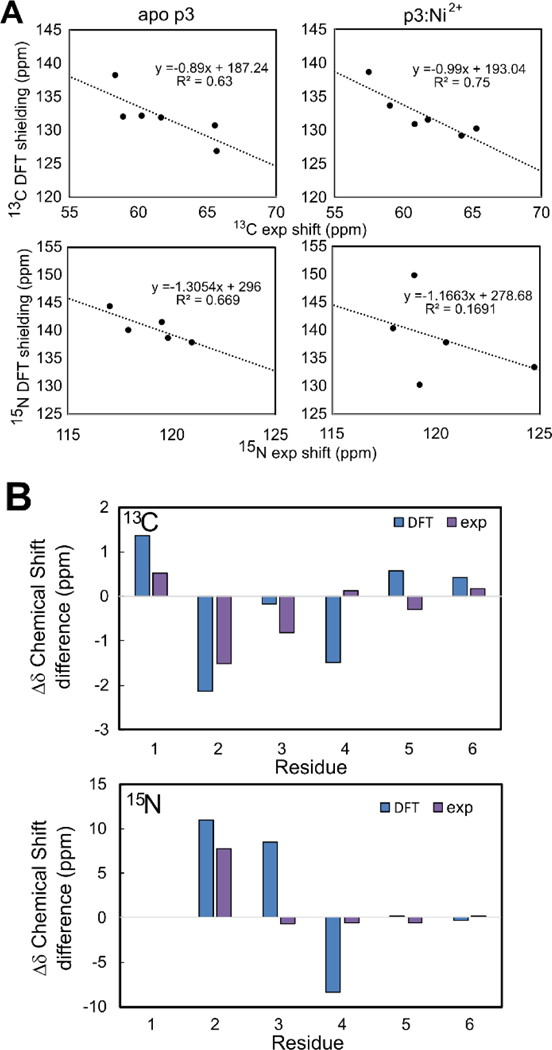
Figure 6.

(A) Comparison of experimental chemical shifts and calculated chemical shieldings for alpha carbons (top) and amide nitrogens (bottom). Plots for apo P3 (left) and Ni2+-bound p3 (right) are shown. Symbols reflect data points and lines are linear regressions, with slopes/intercepts and R2 values displayed above the plot. (B) Comparison of experimental (purple) and DFT-derived (blue) chemical shift differences between apo-P3 and Ni2+-bound p3. Data for alpha carbons (top) and amide nitrogens (bottom) are shown.
