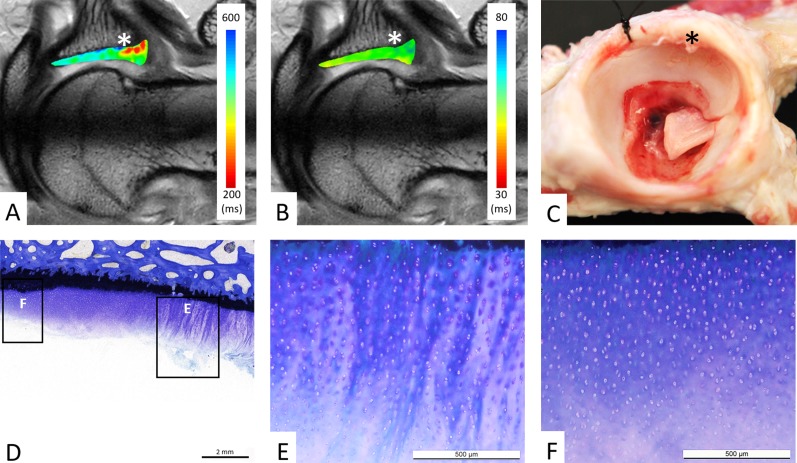
Fig. 2 A-F.
(A) dGEMRIC values and (B) T2 values of acetabular cartilage are color-coded on a radial cut at the level of the posterosuperior acetabulum (sector A). (A) The focal decline in dGEMRIC values is visible (red color) at the chondrolabral transition zone (asterisk), which indicates glycosaminoglycan depletion corresponding to early biochemical cartilage damage. (B) By contrast, T2 values show a homogenous distribution (green color) of T2 values, including the chondrolabral transition zone (asterisk). (C) Macroscopic inspection confirms the chondrolabral lesion in the transition zone (asterisk). (D) Corresponding histologic section with toluidine blue staining confirms the lesion in the chondrolabral transition zone with adjacent peripheral (E) and central (F) acetabular cartilage degeneration. (D-E) Total Mankin score of 7 points for the peripheral cartilage lesion: clefts extending into the transitional zone (3 points), diffuse cell proliferation (1 point), moderate discoloration (2 points), and disrupted tidemark (1 points). (D, F) Total Mankin score of 4 points for the central cartilage: surface fibrillation (2 points), diffuse cell proliferation (1 point), minor discoloration (1 points), and intact tidemark (0 points).

