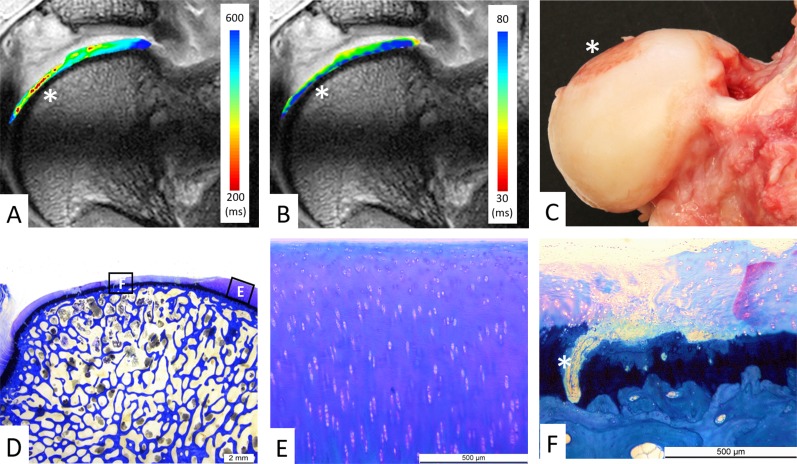
Fig. 4 A-F.
(A) dGEMRIC values and (B) T2 values of femoral cartilage are color-coded on a radial cut through the superior femoral head (12 o’clock position). (A) The focal decline in dGEMRIC values is visible (red color) in the thinned-out central cartilage region (asterisk), which indicates glycosaminoglycan depletion corresponding to early biochemical cartilage damage. (B) By contrast, T2 values do not indicate a focal damage pattern. (C) Macroscopic inspection confirms the central femoral cartilage lesion (asterisk). (D) Corresponding histologic section with toluidine blue staining shows intact (E) peripheral cartilage and (F) central cartilage degeneration. (D-E) No histologic signs of cartilage degeneration (0 points). (D, F) Total Mankin score of 12 points for the central cartilage: cleft into the calcified cartilage (5 points), cell loss (3 points), severe discoloration (3 points), and disrupted tidemark (1 point, asterisk).

