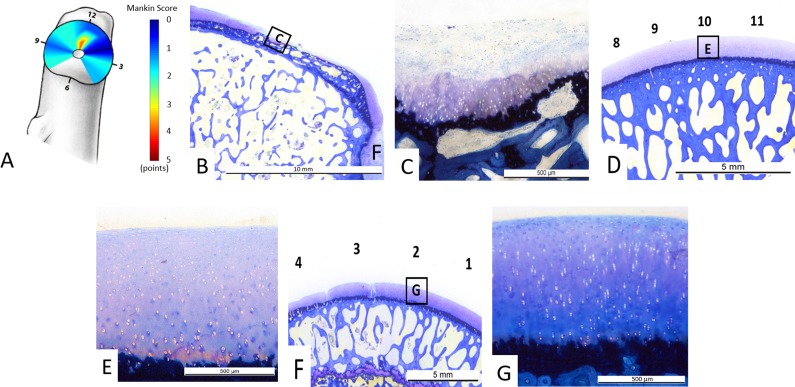
Fig. 6 A-G.
(A) Overall distribution of Mankin scores and (B–G) illustrative examples for grading of Mankin scores from different femoral clockface positions. (A) Overall the most severe histologic cartilage lesions were observed in the central superior (12 o’clock position) region as indicated by the red color. (B) Histologic sample from the 12 o’clock face position shows a typical lesion adjacent to the fovea capitis with (C) a Mankin score of 11 points: clefts extending into the radial zone (4 points), cell loss (3 points), severe discoloration (3 points), and a disrupted tidemark (1 point). (D-E) Histologic samples at the 10 o’clock position show no cartilage degeneration with a Mankin score of 0. (F-G) Histologic samples at the 2 o’clock position show no central cartilage degeneration with a Mankin score of 0.

