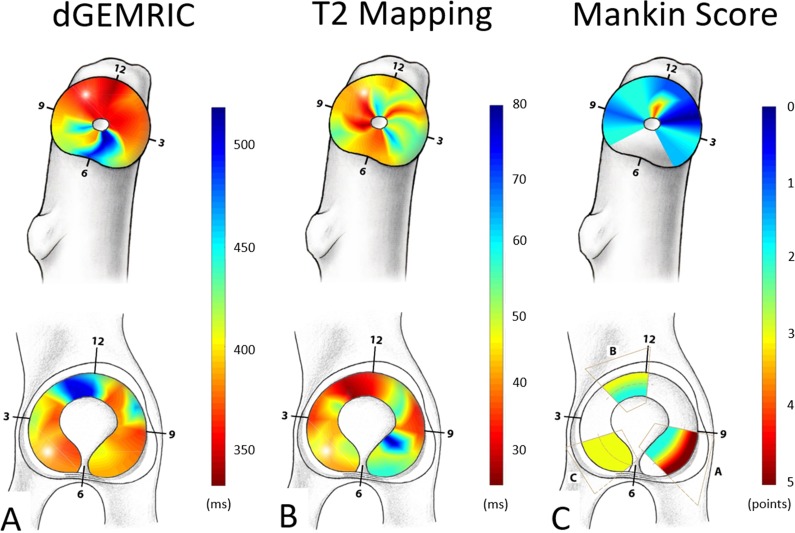
Fig. 7 A-C.
Regional distribution of (A) dGEMRIC values, (B) T2 values, and (C) histologic Mankin scores of the femur and the acetabulum are shown. Blue color indicates good cartilage quality on biochemical MR images (A-B) and for the histologic gold standard (C). Conversely, the red color indicates cartilage damage for both MRI techniques (A-B) and for the histologic gold standard (C).

