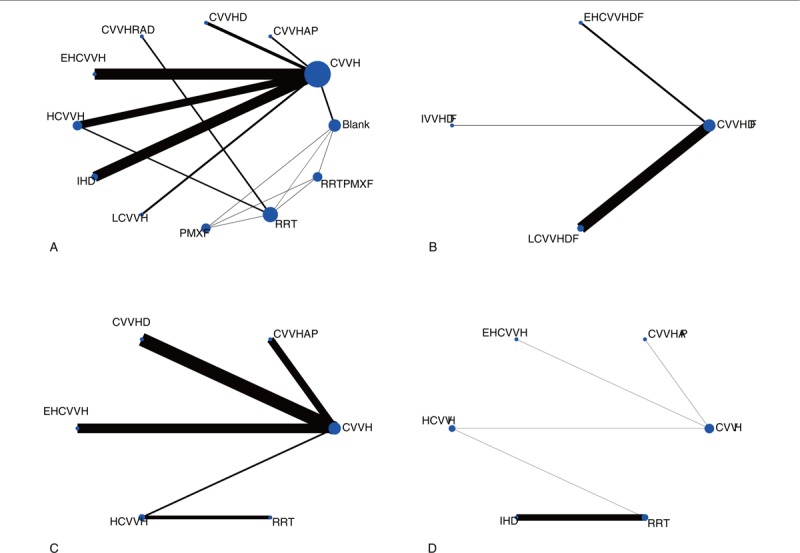
Figure 2.

Network of the comparisons of the RRT strategies included in the analyses. (A) First part of the survival rate; (B) Second part of the survival rate; (C) Renal recovery rate; (D) ICU duration. In the network plot, the line between 2 interventions indicates a direct comparison, and the thickness indicates the precision of the direct estimate in each pairwise comparison. The nodes are weighted according to the number of studies. The abbreviation definitions are listed in Table 1. ICU = intensive care unit, RRT = renal replacement therapy.
