Figure 4.

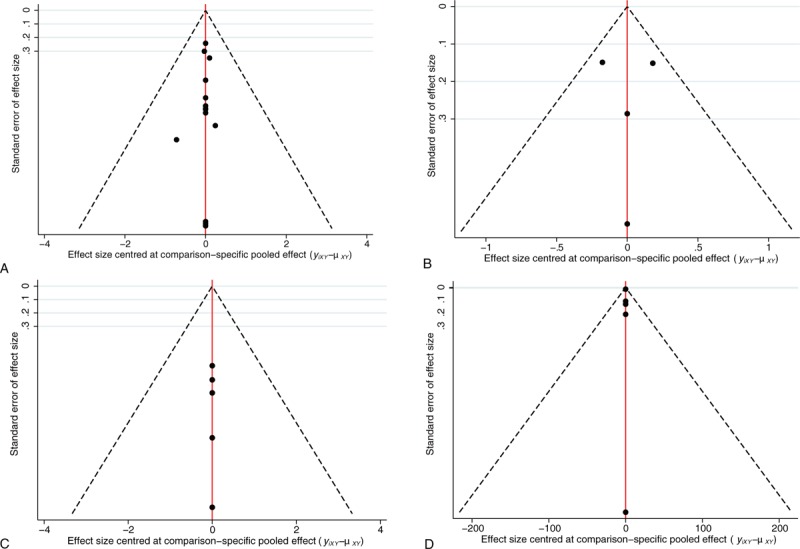
Comparison-adjusted funnel plot used to assess the first (A) and second parts of the survival rate results (B), renal recovery rate (C) and ICU duration results (D). ICU = intensive care unit.

Comparison-adjusted funnel plot used to assess the first (A) and second parts of the survival rate results (B), renal recovery rate (C) and ICU duration results (D). ICU = intensive care unit.